Color Settings
Your choice of Color Settings determines what the Colors shown in the Top View mean.
Normally there will always be a Progress
Grid Model, the Grid Model A type of DTM that is made manageable through sampling measured points into a regularly spaced raster, allowing fast and conditional access. Considered to be a secondary data set; since no original points are kept.. that is updated by your operations and
survey updates. There may also be other Grid A type of DTM that is made manageable through sampling measured points into a regularly spaced raster, allowing fast and conditional access. Considered to be a secondary data set; since no original points are kept.. Models selected under Supporting
Shapes A geometric entity or a collection of such entities. Each entity is described by basic geometry such as a point, a line or an arc. Examples of shapes are: Route, Centerline, Waypoints, Fix Set, Dump Boxes, Progress Grid Model, Designs, etc.. Your choice of Color Settings will be applied to all Models selected
for the Top View.
A type of DTM that is made manageable through sampling measured points into a regularly spaced raster, allowing fast and conditional access. Considered to be a secondary data set; since no original points are kept.. that is updated by your operations and
survey updates. There may also be other Grid A type of DTM that is made manageable through sampling measured points into a regularly spaced raster, allowing fast and conditional access. Considered to be a secondary data set; since no original points are kept.. Models selected under Supporting
Shapes A geometric entity or a collection of such entities. Each entity is described by basic geometry such as a point, a line or an arc. Examples of shapes are: Route, Centerline, Waypoints, Fix Set, Dump Boxes, Progress Grid Model, Designs, etc.. Your choice of Color Settings will be applied to all Models selected
for the Top View.
Depending on your equipment type, in Color Settings you can choose to show different layers.
On this page:
Advice:
for Marine Equipment In VOSS RT Equipment is the collective name for all marine and land machinery provided with positioning (and attitude devices)., safe navigation is of paramount importance: therefore
it is advised to always show the Safety Contour, which will be shown independently
from your choice of Color Settings. See: Safety
Contour
The current Color Setting is always shown at the right of the Top View:
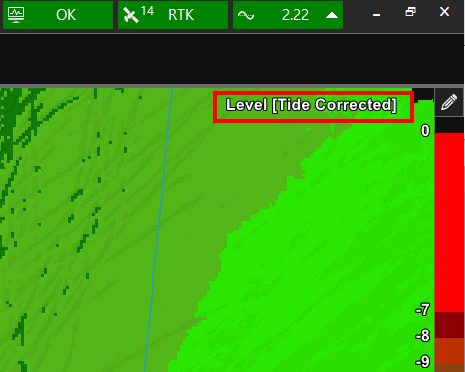
The Color Table that is used is always visible vertically along the right side of your Top View.
Color Settings
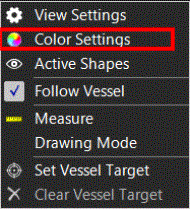
To change the Color Settings:
 Right mouse click
Top View > Color Settings
Right mouse click
Top View > Color Settings
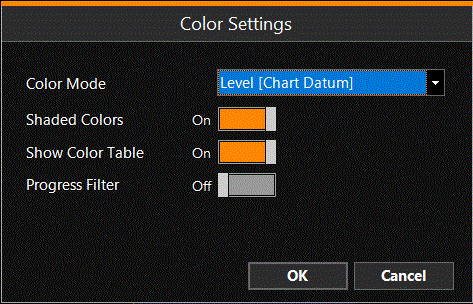
|
Color Settings |
|
|---|---|
|
Color Mode |
Choose from the pull down menu, which Color Mode you want to use for your Top View. See below: Color Mode. |
|
Shaded Colors |
Use of Shaded Colors gives additional insight into your Surface Model |
|
Show Color Table |
The Color Table that is used is visible vertically along the right side of your Top View. |
|
Progress Filter |
When Off, all data as available will be shown. When On, you can select to Show Progress Since a certain date only. See line below. |
|
Show Progress Since |
Select a date from which to show the data. See also: Progress Filter |
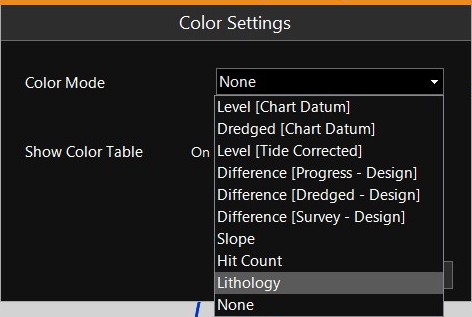
Color Mode
|
Color Mode |
|
|---|---|
|
The Top View will be colored according to the Levels (heights) from
the Model that is chosen for Progress Grid Model In this Color Mode the levels are shown referred to Chart Datum. The Color Table will be as defined at: Active Color Tables. |
|
|
Dredged [Chart Datum] |
The Top View will be colored according to the Dredged depths. |
|
Level [Tide Corrected] |
The Top View will be colored according to the Levels (heights) from the Model that is chosen for Progress Grid Model (see: Select or change Progress Grid Model). In this Color Mode the levels are shown to the actual water level, from the active Height Source (see: Tide Control - Height Control) The Color Table will be as defined at: Active Color Tables. |
|
Difference |
The Top View will be colored according to difference between the Active Design Model (see: Design) and:
A positive difference means the Design is deeper than the selected Grid Model. The Color Table will be as defined at: Active Color Tables |
|
Used mainly by Suction Dredgers, not visible in this screen capture. The Top View will be colored according to the Mixture Density from the active Production Model (see: Select or change Production Model). The Color Table will be as defined at: Active Color Tables. |
|
|
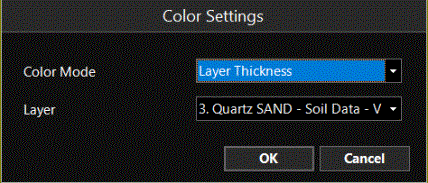
Layer Thickness |
Not visible in this screen capture. To be able to display Layer Thickness you need to have loaded Soil Layers in your Supporting Shapes.
Choose the Soil Layer |
|
Slope |
The Grid Model will be shown in the slope colors as defined in the Color Table. It is more of use to surveyors than to operators of equipment. |
|
Hit Count |
This will show the number of hits per grid cell. It is more of use to surveyors than to operators of equipment. |
|
Lithology |
To be able to display Lithology (data from Boreholes |
|
Standard Deviation |
Not visible in this screen capture. This will show the standard per grid cell. It is more of use to surveyors than to operators of equipment. |
|
None |
No Grid Model colors will be shown in the Top View. |
Adapt Color Table that is in use
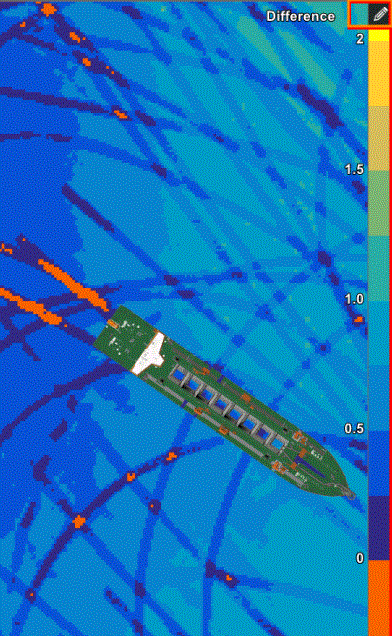
Click on the pencil in the top right hand corner to change the Color Table that is in use at this moment.
In the example above the Color Mode is Difference:
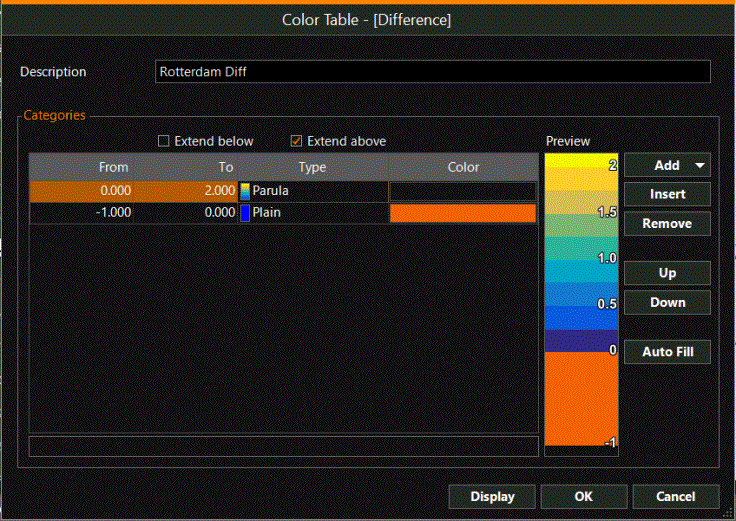
The Color Table for Difference that was chosen at Operation Settings -> Color Tables is shown.
You can now either adapt this color table, click OK, and the changed version of Rotterdam Diff is saved.
Or you can type a new name after Description, adapt the Color Table, click OK and the newly created Color Table is saved and Active for use.