Progress Grid Model
In VOSS RT
the Progress Grid A type of DTM that is made manageable through sampling measured points into a regularly spaced raster, allowing fast and conditional access. Considered to be a secondary data set; since no original points are kept..
Model is the surface model
that shows the operator the latest situation of the levels in the working
area.
A type of DTM that is made manageable through sampling measured points into a regularly spaced raster, allowing fast and conditional access. Considered to be a secondary data set; since no original points are kept..
Model is the surface model
that shows the operator the latest situation of the levels in the working
area.
The Progress Grid Model The Grid Model that will show the current levels in your working area. It is updated by survey updates and by your head(s) (Dredgehead, bucket, WID bar, plough, etc.) is kept up to date by new Survey Data and depending
on your equipment
type, it is also updated by your operations, called updating.
There can only be one Progress Grid Model A type of DTM that is made manageable through sampling measured points into a regularly spaced raster, allowing fast and conditional access. Considered to be a secondary data set; since no original points are kept.. active at a time and normally
this model will not be changed during a Project An area of work that is defined and described by its tasks and/or its data sets. A project is an integrated part of any one (1) Geodetical Region..
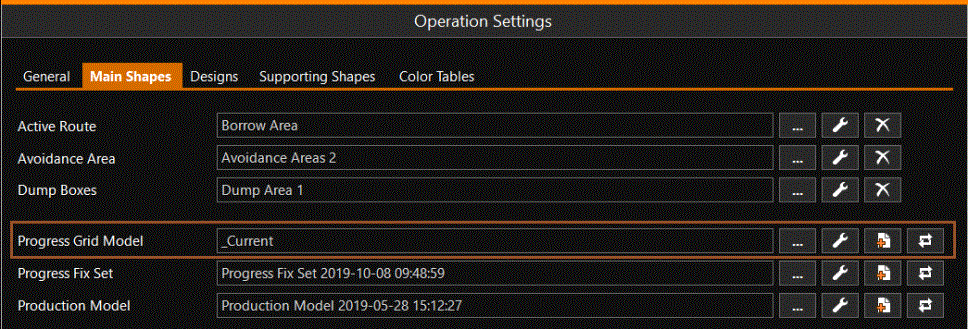
The Progress Grid Model is one of the Main Shapes.
Under Main Shapes A geometric entity or a collection of such entities. Each entity is described by basic geometry such as a point, a line or an arc. Examples of shapes are: Route, Centerline, Waypoints, Fix Set, Dump Boxes, Progress Grid Model, Designs, etc. the Progress Grid Model is specified:
 MENU > Operation
Settings > Main Shapes > Progress Grid Model or:
MENU > Operation
Settings > Main Shapes > Progress Grid Model or:
Keyboard: F1 >
Main Shapes > Progress Grid Model
Click [...] to select your Progress Grid Model
Click [spanner] to adapt the way the Progress Grid Model is shown in Section views
Click [Create new progress grid] to create a new empty Progress Grid Model
Click [Update history] to inspect the history of survey updates that have been applied to the model
The information in the Progress Grid Model can be shown in the Top View in various ways, see: Color Settings
Example of Progress Grid Model
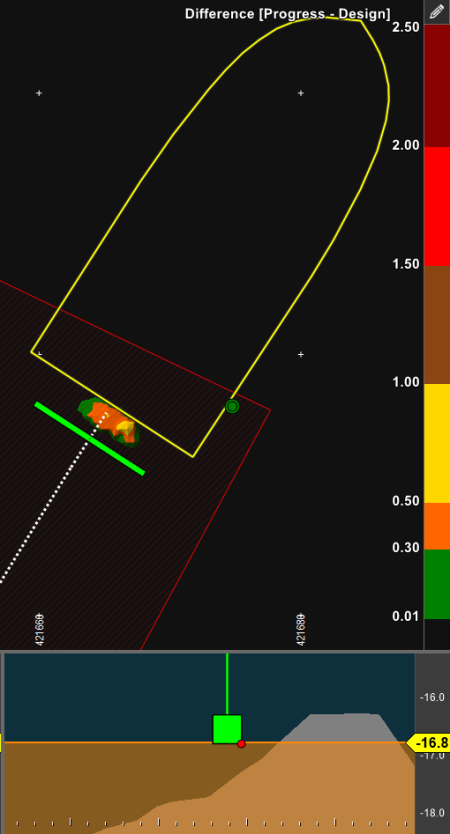
In the picture above a plough vessel is shown.
The Top View shows Progress levels minus Design levels.
The plough on the aft of the vessel is approaching a high spot that is above the design and is just in front of the plough.
The high spot can also be seen in the Profile View.
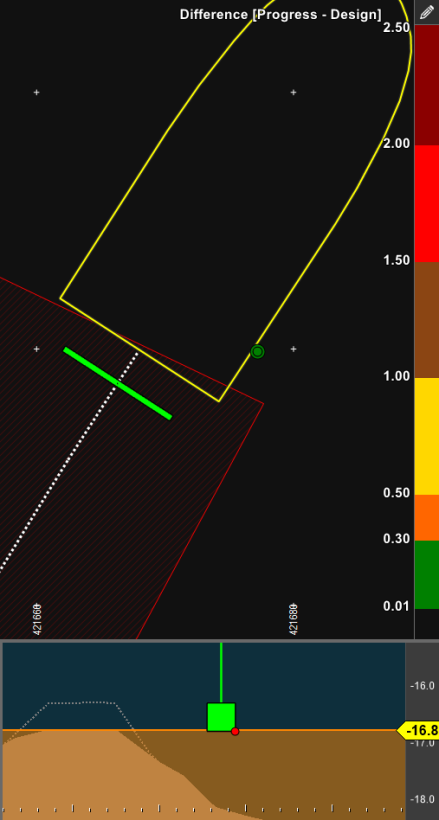
In the picture above the plough has passed the high spot on the Design Level (-16.8 [m.]).
The plough has updated the Progress Model to the level the plough was at.
The high spot has disappeared from the Progress data.
The latest Surveyed data is still present in the Progress Grid Model and can be seen in the Profile View as a dotted line:
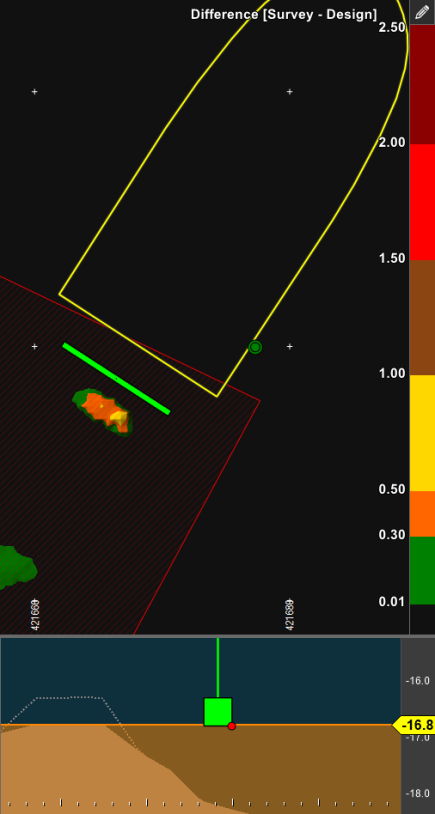
To be able to see the Latest Survey data in the Top View, change the Color Settings to Difference [Survey - Design].
The Survey Layer of the Progress Grid Model contains the latest received Survey data.
To check if the high spot is indeed removed by the plough, a new survey should be executed.
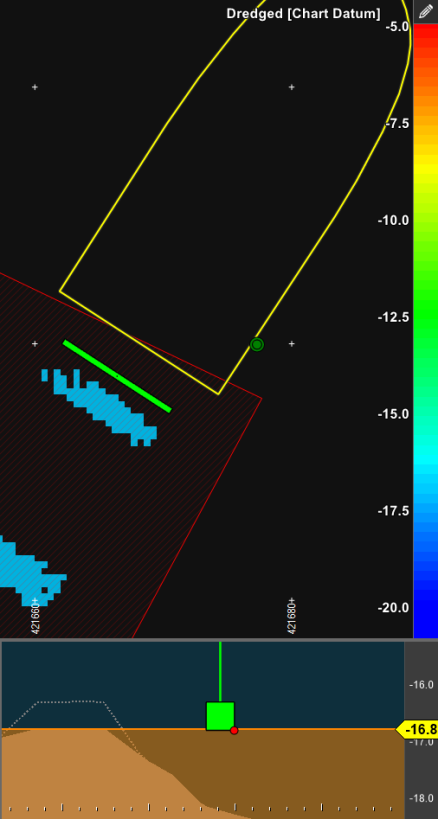
When you select to see the Dredged Levels (to Chart Datum) via Color Settings, you can see where the Progress Levels were updated by the plough.
Note that when the Dredged levels are shown, only the areas of the Progress Grid Model that were updated by your equipment are shown.
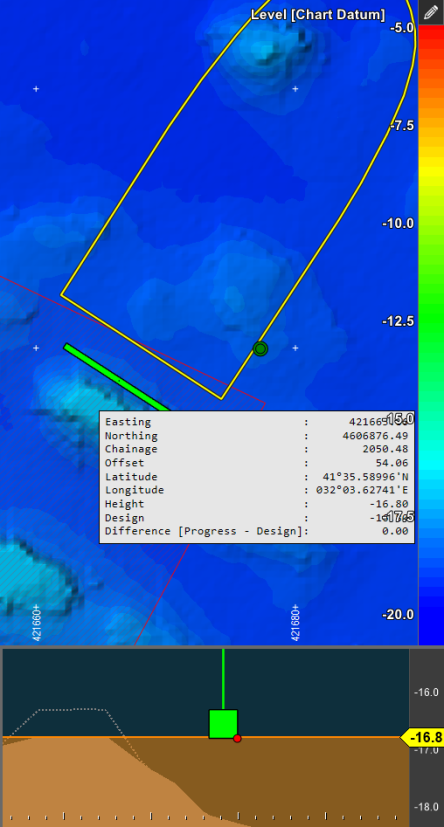
When you select to view Progress Levels (to Chart Datum) via Color Settings, you will see the combination of latest Survey data and updates by the plough.
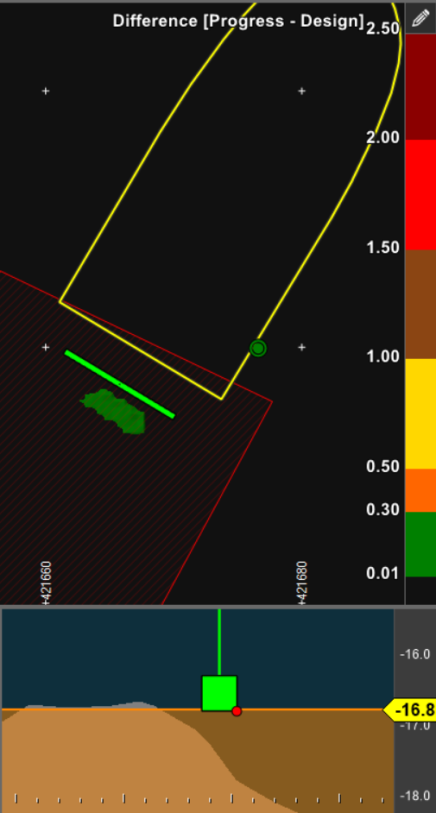
A survey was done that covered the high spot. It was mailed to the vessel
and imported via Import Package.
Both the survey data and the progress levels were updated in the Progress Grid Model.
The survey shows that the high spot was not removed completely to the Design level.
The way the Progress Levels in the Progress Grid Model are updated is chosen by the surveyor that prepared the update, see: Progress Grid Model - time based update