Time Series
Time Series is a presentation of a range of data. This can be any kind of device data, computation or system info.
Ranges and axes can be modified via Time Series Settings, as well as Saving and Loading a selection of items.
On this page:
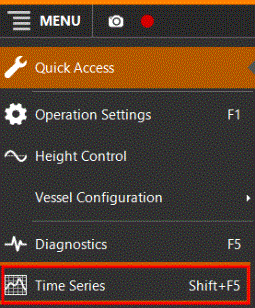
To start Time Series:
 MENU > Time Series
or:
MENU > Time Series
or:
Keyboard Shift+F5
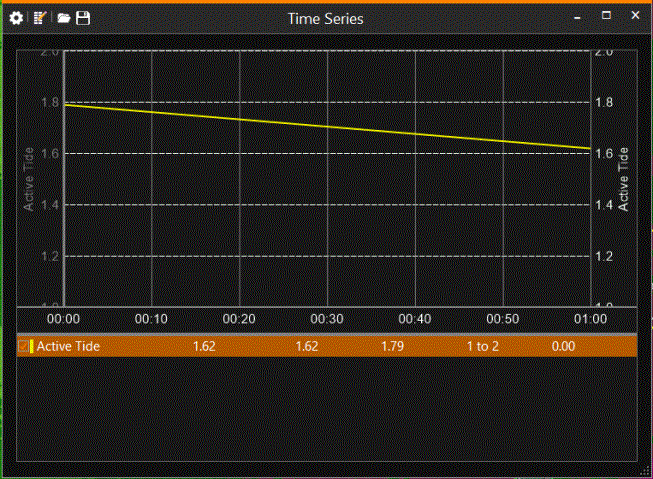
As an example, Time Series can be used as tool for tide monitoring:
Another example of Fore and Aft draft:
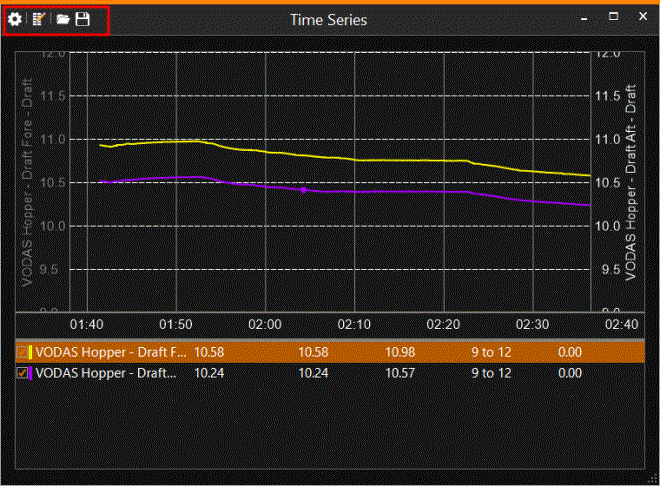
The menu bar at the top left hand side offers options to fill in the Settings and the Items to view:
Settings, Edit Items, Load Settings, Save Settings.
View Settings
The Time Series View can also be added via Menu > Screen Layout > Add View and has the same menu options in the right mouse menu:
Right mouse click in
Time Series > View Settings
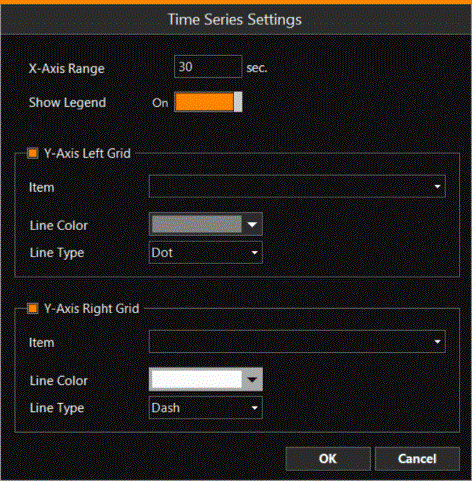
Enter settings for the looks of the values in the Time Series.
Edit Items
Switch on the displaying of certain info within the Time Series display:
Right-click in the Time Series display > Edit Items > scroll down in left hand column
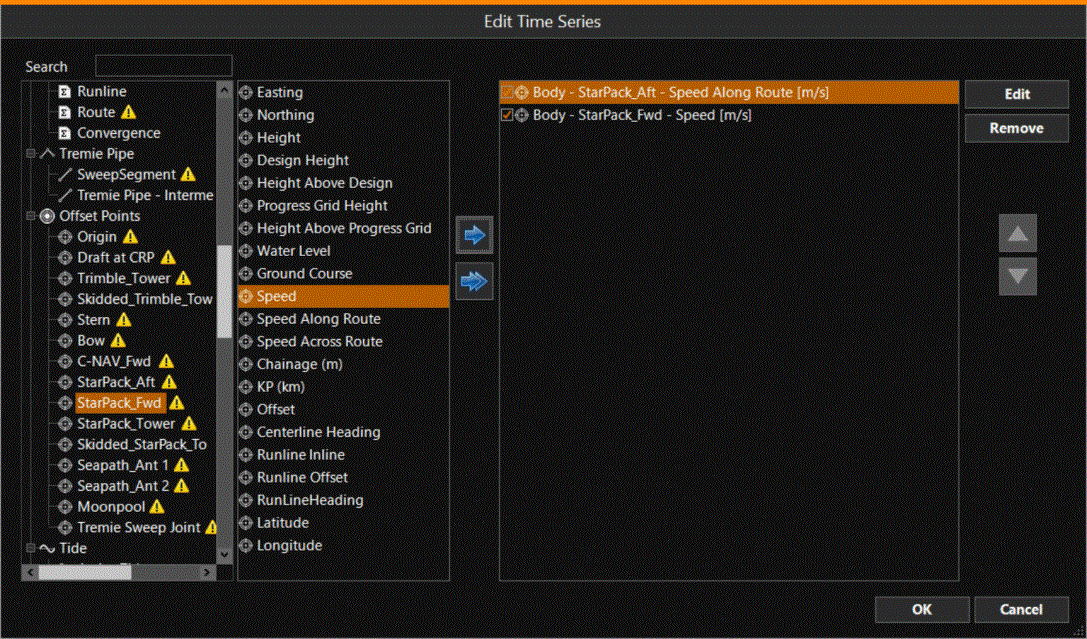
Select which items you would like to see and click the blue arrow to move them to the right hand column.
Edit - Highlight an item in the right hand column and edit its settings.
This offers the options to make this information line stand out in the Time Series View:
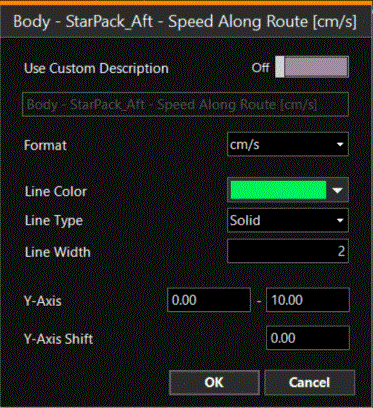
Click OK to save the individual settings and click OK again to save the selection.